

Eight years. That is the amount of time left, on average, that the 12 cities that make up EG’s Sustainable Cities Index have left to meet their net zero targets. That is less than 100 months, less than 3,000 days. That time will pass very quickly, even if those numbers look big right now.
And with the country’s local authorities under increasing financial pressure, political parties U-turning on green initiatives, but the need to make impactful change ever increasing, it has never been more important for public and private sectors to work together to ensure our cities remain viable.
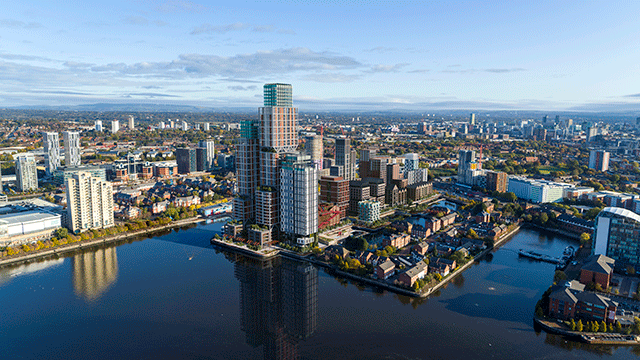
EG revisits its Sustainable Cities Index, a unique look at 12 of the UK’s major cities, to see what progress is being made as we race towards achieving net zero.
This year’s index provides a mixed view. The results show something of a bounce back to activity – and therefore some negative impacts on our environment – following the pandemic-induced breather for the planet. Across the board, emissions have increased and air quality has declined, indicating a return to commuting by car, flying etc.
Comparing data with our last index, published in autumn 2022, emissions per capita have increased across all 12 cities from an average of 3.2 tonnes to 4.1 tonnes – putting emissions back in line with 2017 averages.
Air quality has shown a notable decrease and while some of the monitoring sites for the cities have changed, on average, air quality has become 75% worse since 2022’s index. However, compared with the first index in 2020, which utilised pre-pandemic figures from 2017-2019, air quality has improved on average by 30%.
But while a return to “normal” activity post-pandemic may have led to more environment-damaging activities, we have also seen increasing access to green space, more buildings with EPC B or above and BREEAM Excellent ratings in our cities, recycling rates have nudged up, biodiversity numbers have improved and, in almost all the cities, the volume of EV chargers has dramatically improved.
Since beginning the index, Bristol has led the rankings with most number one positions on the criteria measured. This time it has been bumped out of several top spots and now only commands the lead in walkability – which it shares with Leeds and Edinburgh – and volume of biodiversity.
Four other cities also held top spots in two of EG’s criteria this year. They were Edinburgh, which retained its top spot as the city with the best air quality of all 12 cities monitored and shared the best walkability score; Manchester, which ranked highest for sustainability in the Thriving Places Index and had the highest number of BREEAM Excellent offices; Southampton, which ranked top for percentage of its building stock that had an EPC rating of A+ and for having the lowest emissions across the cities studied; and Leeds, which not only shared that walkability ranking but was also joint first in the percentage of its building stock rated EPC A+.
Bristol’s bump from holding the highest number of top spots is, in this case, a good thing, signalling that its peers across the UK are catching up with the city that has been a clear leader in the EG Sustainable Cities Index since its inception. Including second-place rankings in the scoring, Bristol surges ahead again with six positions held, against three for its nearest rivals – Edinburgh, Manchester and Leeds.
When it comes to delivering infrastructure to help drive cities – quite literally – towards a more sustainable future, Liverpool has to be congratulated. According to government figures, the city is leagues ahead of its peers when it comes to EV charging points per 100,000 people. The city has almost 125 charging points per 100,000 people, 65% more than second-ranked city Edinburgh and nearly four times as many as bottom ranked city, Bristol.
EV charging infrastructure has improved dramatically across all 12 cities in this year’s index, with only Bristol and Newcastle lagging behind.
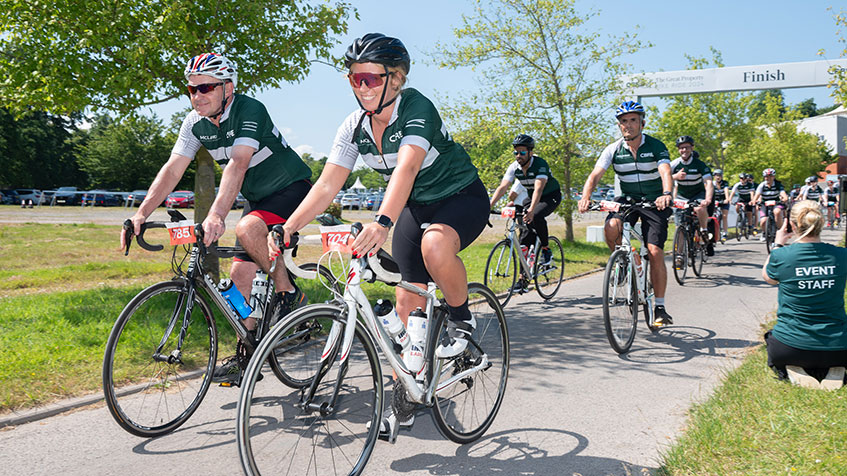
The most environmentally friendly form of transport, of course, is walking. Here eight out of our 12 cities were given walkability scores of 90% or higher, with three – Bristol, Edinburgh and Leeds – getting near-perfect scores of 99%. Glasgow remains bottom of the list for walkability for the second time in a row with a score of just 67%.
All bar three of the cities monitored were ranked lowest at least once on EG’s Sustainable Cities Index criteria. Only Edinburgh, Sheffield and Newcastle escaped a “worst for” nomination. Alongside Glasgow’s worst for walkability, Manchester ranked lowest for air quality, Liverpool on the Thriving Places Index, Leeds for biodiversity, Nottingham for percentage EPC B and above-rated stock and Bristol for EV charging.
Two cities had two “worst for” rankings. Birmingham for average distance to green space and its recycling rate – figures show the average distance to the nearest green space in the city is 356m (compared with 259m in Newcastle) and a recycling rate of just 23% (compared with 58% in Cardiff).
While Cardiff may take the prize for recycling, it remained the only city not to have any EPC A-rated buildings and had the highest emission rates (and biggest increase) of all 12 cities.
What this year’s figures teach us is that while our cities and citizens can and are making positive changes for the planet across a range of measures, much more work is needed to be done around emissions if we really are to slow global warming and ensure our cities remain viable for generations to come.
And just 3,000 days remain to get there.