Take-up fell by more than a third in Q3 year on year and investment plunged to record lows. Is it a sharp shock post the Brexit vote or a sign of worse things to come? Alexander Peace reports
Cast your mind back three months, to the immediate aftermath of the EU referendum, when all hell was breaking loose. Tenants were soon to be evacuating to Paris and Dublin, REIT shares had fallen by more than 20%, and the London office market reported its lowest quarter of take-up since the euro contagion crisis in 2011.
Information was sparse, rumour was rife, and no one knew what was going on. Three months down the line it is better, but only just.
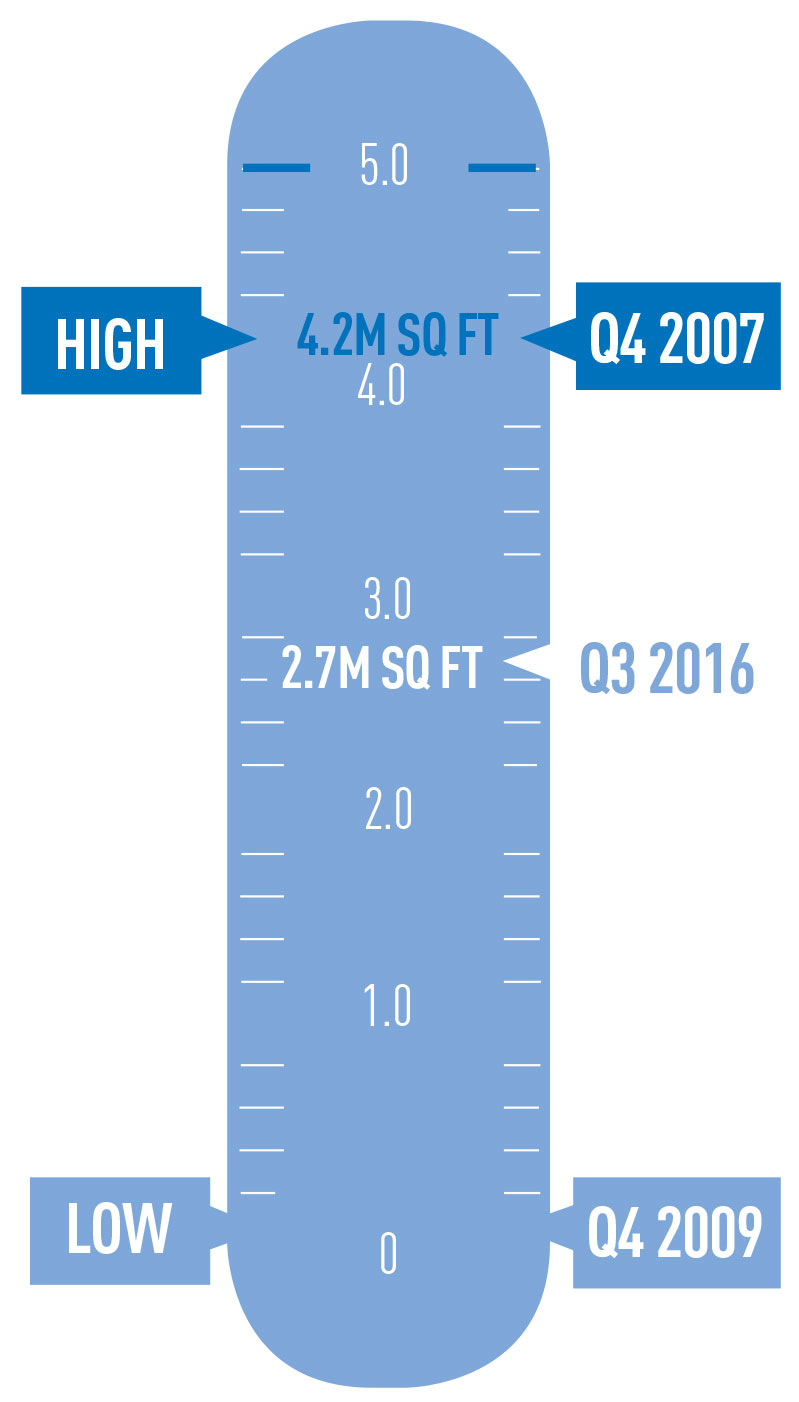
Take-up, while up by 10% on the “wait-and-see Q2”, plunged by 37% compared with the third quarter of 2015, according to EG’s London Offices Market Analysis. Investment is even worse. Underneath the headlines, a third fewer transactions completed, on a year-on-year basis.
After the dreadful weeks post-referendum, there has come a realisation that the world has not yet ended. Deals and lettings have been done. Fees have been earned.
There was also a resounding vote of confidence for the capital by big corporates with the letting to Apple at Battersea, SW8, at the end of September, and the no-less-critical sale and letting of 33 Central, EC4, to Wells Fargo in July.
But as last month’s plunging pound statistics show, the market is vulnerable to external shocks.
A one-month quarter
At 2.2m sq ft, take-up was the lowest it has been in a Q3 since 2012. Even with the Apple letting included, it was well down on trend.
Every market except the South Bank was down on the year before. In the case of the City fringe and Midtown, take-up fell by 60% in each.
“It’s patchy. That is the honest way to describe it,” says Dan Bayley, head of central London agency at BNP Paribas Real Estate.
“It’s fair to say that viewing levels are down for core and fringe. The concern is that fewer viewings mean fewer requirements going forward. The challenge is to see how real requirements are. And which come off.”
There is a little evidence that take-up is merely improving as people recover from the shock of the Brexit decision. Month on month, take-up rose in September, up on a very quiet August, but down on July, when a number of deals completed post-referendum, despite the result.
For some, that in itself is a result.
“I think there has been surprise,” says Stephen Clifton, Knight Frank’s head of central London. “Given that Q3 2016 was effectively a one-month quarter due to the shock of the referendum result, and then August saw the traditional holiday slowdown – the market is looking relatively healthy compared with what everyone was expecting back in June.”
Churning on
The view is that, end of the world or not, the market must continue to churn. And for agents, that churn is echoed in the league table results.
CBRE swept to the top spot overall – though without Apple it would have been Cushman & Wakefield – and Colliers International took the City fringe as its acquisition of Hatton Real Estate paid off.
The City market saw a minor shake-up, as Gerald Eve flew up the rankings despite acting on just two deals, though one of these was Wells Fargo at 33 Central, which counts as a disposal. It pipped Knight Frank by just 251 sq ft.
Those numbers were hard won with only seven deals of more than 50,000 sq ft – and just two of more than 65,000 sq ft. There is a view that levels seen in 2014 and 2015 were the top of the market anyway.
In other markets, that trend continued, but with smaller numbers. In the West End, where just one deal at more than 50,000 sq ft completed – the 58,000 sq ft letting to PA Consulting Group at Stag Place, SW1, JLL once again took the top spot, beating CBRE.
“There’s an expectation that it is not like it was, but that always felt like a bit of an aberration,” says Philip Pearce, executive director of central London at Savills. “Maybe we are going back to the old norm. Is there a trend? When you look towards under-offers as at the end of September, there were just over a million, which is pretty healthy.”
Rents and prelets
Where deals are being done, they are being done more slowly, and with more options, because, as has become obvious, it is a cautious marketplace.
“We have to move forward and hope for the best, but our plans also need to include the worst,” says Digby Flower, head of London markets at Cushman & Wakefield.
“Landlords are providing more flexibility in terms of option space on the big prelets, because people understand that if you are committing to a building two years out, you need the ability to shift 20%.”
The figures tell a similar tale: asking rents on new-builds and secondhand space are pretty steady, dropping by a single percentage point quarter on quarter. But lease terms are again pushing out, from a couple of months rent-free to three or four, and with percentage increases of around 10% quarter on quarter.
Rents |
|||||||
|---|---|---|---|---|---|---|---|
| Sub market | Location | Av rent Q2 (£) | Av rent Q3 (£) | Q/Q % change | Av month rent free Q2 | Av month rent free Q3 | % change |
| City core | Gresham St/Leadenhall St/Broadgate | 69.7 | 69.5 | -0.2 | 19 | 21 | 6.4 |
| City fringe | Aldgate | 58.4 | 57.4 | -1.7 | 19 | 20 | 9.1 |
| Midtown | Chancery Lane | 68 | 67.6 | -0.6 | 16 | 18 | 2.2 |
| Midtown | Covent Garden | 83.5 | 81.9 | -1.9 | 14 | 16 | 1.4 |
| Midtown | Euston Road | 69.9 | 70.3 | 0.5 | 15 | 17 | 6.9 |
| West End | Mayfair/ St James | 123 | 121.7 | -1.1 | 13 | 15 | -0.7 |
| West End | Victoria | 80.3 | 80.2 | -0.1 | 16 | 18 | 4.2 |
| West End | Soho | 85.8 | 86 | 0.3 | 15 | 16 | 0.6 |
| West End | Paddington | 66.3 | 65.5 | -1.3 | 16 | 17 | 7.4 |
| South Bank | More London | 61.8 | 63.4 | 2.7 | 16 | 18 | 3.6 |
| Docklands | Canary Wharf | 45.9 | 45.5 | -0.9 | 23 | 24 | 9.1 |
Looking ahead
There is no one explanation of what is going on.
While it is certainly not an apocalypse, it is far from business as usual. Much of it comes down to the tacit acceptance that Brexit will be with us for years to come, and tenants will still need space in the meantime.
“Brexit will take a long while to resolve, and they [tenants] have to get moving anyway. Those that did not abandon their requirements are saying they will move forward,” says Flower.
“Anyone who thinks they are going to get an easy answer within two-and-a-half years… It will be five, six or seven before it is all done. And people in our market have reached the point at which they cannot do nothing, so they might as well get on with it,” he adds.
Coupled with that, the same old lack of supply and low vacancy rates continue to put the pressure on tenants.
“The good thing about Brexit, in a funny sort of way, is that development that was going to happen in the next three to four years has been pushed out,” says Simon Williams, head of investment at BNP PRE. “On the office side of things, we do not have the oversupply looming.”
Submarket of the week
Battersea’s worst-kept secret, the letting to Apple, was finally confirmed on 28 September, just in time to be included in the Q3 numbers.
Unfortunately, the Battersea/Nine Elms market is so cutting edge that it cannot be included in the overall take-up figures, though it has been included in the agency stats. But it was nevertheless a major fillip, and a good sign of future confidence.
Perhaps more interesting is the thought that Battersea could become a major office destination. With two super tenants such as the US Embassy and Apple there, it is going to have its own gravity, and the Northern line extension is going to make a major difference – though it is worth remembering that neither Apple nor the Underground will happen until 2021 at the earliest.
Perhaps more important is the rise of yet another submarket, and its domination of the quarter’s take-up.
Last year in Q2, it was Stratford that made its presence as a submarket felt with two major lettings – the FCA and TfL. This year, it is Battersea. Next year it could be Croydon or the Royal Albert Docks.
“The one thing that is definite, whether it is Croydon or Battersea, is that those markets are going to have an important part to play in the leasing of London,” says Bayley.
SUBMARKETS
CITY |
||||
|---|---|---|---|---|
| Agent | Sq ft | No deals | Market share | |
| 1 | Gerald Eve | 244,238 | 2 | 35.1 |
| 2 | Knight Frank | 243,987 | 5 | 35.1 |
| 3 | Cushman & Wakefield | 119,791 | 13 | 17.2 |
| 4 | JLL | 104,286 | 16 | 15 |
| 5 | Gryphon Property Partners | 66,123 | 3 | 9.5 |
City Fringe |
||||
|---|---|---|---|---|
| Agent | Sq ft | No deals | Market share | |
| 1 | Colliers International | 176,174 | 19 | 46.8 |
| 2 | Cushman & Wakefield | 161,426 | 9 | 42.9 |
| 3 | BNP Paribas Real Estate | 133,584 | 5 | 35.5 |
| 4 | Pilcher Hershman | 43,125 | 3 | 11.5 |
| 5 | CBRE | 36,843 | 3 | 9.8 |
Docklands |
||||
|---|---|---|---|---|
| Agent | Sq ft | No deals | Market share | |
| 1 | Cushman & Wakefield | 63,012 | 3 | 54 |
| 2 | Cherryman | 41,763 | 2 | 35.8 |
| 3 | JLL | 27,624 | 7 | 23.7 |
| 4 | GM Real Estate | 26,204 | 6 | 22.4 |
| 5 | Gryphon Property Partners | 20,754 | 1 | 17.8 |
Midtown |
||||
|---|---|---|---|---|
| Agent | Sq ft | No deals | Market share | |
| 1 | CBRE | 116,865 | 11 | 39.1 |
| 2 | Farebrother | 101,868 | 6 | 34.1 |
| 3 | Savills | 75,417 | 5 | 25.3 |
| 4 | JLL | 72,530 | 3 | 24.3 |
| 5 | Edward Charles & Partners | 15,652 | 3 | 5.2 |
South Bank |
||||
|---|---|---|---|---|
| Agent | Sq ft | No deals | Market share | |
| 1 | CBRE | 101,438 | 5 | 58.7 |
| 2 | Union Street Partners | 65,941 | 11 | 38.2 |
| 3 | JLL | 29,182 | 5 | 16.9 |
| 4 | Knight Frank | 20,115 | 3 | 11.6 |
| 5 | Cushman & Wakefield | 9,175 | 1 | 5.3 |
West End |
||||
|---|---|---|---|---|
| Agent | Sq ft | No deals | Market share | |
| 1 | JLL | 156,926 | 15 | 24.9 |
| 2 | CBRE | 129,198 | 18 | 20.5 |
| 3 | Colliers International | 118,373 | 11 | 18.8 |
| 4 | Knight Frank | 98,129 | 9 | 15.5 |
| 5 | Cushman & Wakefield | 96,014 | 8 | 15.2 |
Research Q3 2016
The suffering of the leasing market is paltry compared to what is happening in the investment sphere, where totals were just £1bn in the city in Q3 – the lowest on record, according to EG’s London Offices Market Analysis.
While a devalued pound may be making assets cheaper, the fact that it is still dropping, not to mention that it is vulnerable to further shocks, and the ongoing doubt about a hard or soft Brexit, means there is difficulty in convincing investors to commit.
“There is a sense that buyers want to feel they are getting some sort of discount post-referendum,” says Rob Hayes, director and co-head of London offices at Colliers International. “There is an increasing amount of uncertainty, and that is a result of what is happening economically, particularly driven by the movement in the pound. The Bank of England saying it may fall further does not bode well for decision-making.”
Figures showed a decline in investment of almost 70% quarter-on-quarter, and a fall of 65% on the year before. The biggest chunk of investment – 57% – went into the West End.
While people are unwilling to commit, others are just as unwilling to sell, as they do not want to be seen as distressed sellers.
The mood coming out of Expo Real earlier this month was that low gilt yields and competitive pricing in Europe means there is nowhere else to go. “The other European markets are right at the top of their cycle. So people are looking at London thinking the currency has moved in most people’s favour, and a lot of vendors are not as punchy as they were, so there are deals to be done,” says Simon Williams, head of investment at BNP Paribas Real Estate UK.
“Sentiment plays a very important role, and it is a lot better than it could have been. OK, it is not what everybody wanted, but London is going to remain the most important commercial destination in Europe,” he adds.
Income will once again become king: particularly the growth that can come in the future.
Hayes says there is still appetite, but adds: “Greater care is being taken when looking at shorter-term-income situations, and how realistic some of those rents are going to be.”
Unfortunately, a lot will also depend on the stability of the pound, and the timing of potential future shocks. If another drop is coming when Article 50 is triggered in March, investors are unlikely to plough into the market now.
Investment agents league table Q3 2016 |
|||
|---|---|---|---|
| Agent | Total (£) | Market share | |
| 1 | Savills | 408.95 | 23% |
| 2 | JLL | 203.25 | 11% |
| 3 | Colliers International | 200 | 11% |
| 4 | Knight Frank | 149.85 | 8% |
| 5 | Cushman & Wakefield | 136.95 | 8% |
| 6 | Michael Elliott | 85.10 | 5% |
| 7 | BNP Paribas Real Estate | 68.35 | 4% |
| 8 | Tudor Toone | 61.85 | 3% |
| 9 | CBRE | 57.57 | 3% |
| 10 | Allsop | 55.02 | 3% |
LOMA dashboard
Top five deals
| Occupier | Building | Size (sq ft) |
Market |
|---|---|---|---|
| 1 | Apple Battersea Power Station, SW8 |
500,000 | South central |
| 2 | Wells Fargo 33 Central, King William Street EC4R |
220,747 | City core |
| 3 | WeWork Aldwych House, 71-91 Aldwych WC2B |
61,951 | Midtown |
| 4 | David Game Tutorial College 31 Jewry Street EC3N |
58,966 | City core |
| 5 | PA Consulting Group Verde (Formerly Eland House), Stag Place SW1E |
58,620 | West End |
Take-up
Developer confidence barometer (construction starts)

FROM THE ARCHIVES
• LONDON OFFICES MARKET ANALYSIS: Q2 2016
• LONDON OFFICES MARKET ANALYSIS: Q1 2016
• To send feedback, e-mail alex.peace@estatesgazette.com or tweet @egalexpeace or @estatesgazette


