The latest take-up figures, submarket analysis and availability rates in the London offices market
Tweet your reactions to @estatesgazette
Click here to receive your free copy of the London Offices Market Analysis
LOMA Q2 2016
Lights out London
Office take-up slumped by more than two fifths in the run up to the referendum. Were tenants already shunning the capital? Alexander Peace reports
It started months ago. Long before a referendum everyone thought would lead to a vote to remain in the EU, take-up in the London office market had already fallen off a cliff.
Not a single deal over 100, 000 sq ft in the whole of central London, and only three scraping over the 50,000 sq ft mark.
From 3.1m sq ft in Q1, it fell by a third to 2m sq ft in Q2. Compared to Q2 2015, it fell by 44%. Q3 could be worse.
In the post-23 June London office market, those trying to make sense of the economic and political uncertainty are also trying to figure out the reasons for that drop. Was it political or was the heat coming out of a market already fit to burst?
With the summer break looming, most are resigned to the fact that there will be little clarity until September, and some even think there will be a boost to the traditionally quiet Q3.
In the wake of the leave vote, all eyes have turned to the City. Questions remain over UK passporting rights for financial services and if this could lead to the relocation of thousands of financial services jobs.
“So far 15 out of 50 deals in the City fringe have fallen out of place, but they have 12 back in place,” says David Hanrahan, co-head of London offices at Colliers International.
“From an agency point of view, it does not feel that bad. We are in state of flux… lack of stock will help, churn always happens anyway, and there are quite a few deals where it is business as usual,” he adds.
Rents and rent frees
The question is, how much are deals being tweaked? With new-build asking rents now nearing an average of £100 per sq ft in the West End, there is inevitably room for them to fall, as they already have in the City, from £71 per sq ft in 2015 to £63 per sq ft today.
“Occupiers are committed to London, but there are caveats to that,” says Adrian Crooks, director of West End office agency at JLL. “Some deals are being tweaked, but only in terms of rent free. Business has to go on, companies have to make money, but there is uncertainty and, until it is sorted, people will ask for greater flexibility.”
[caption id="attachment_856527" align="alignright" width="400"]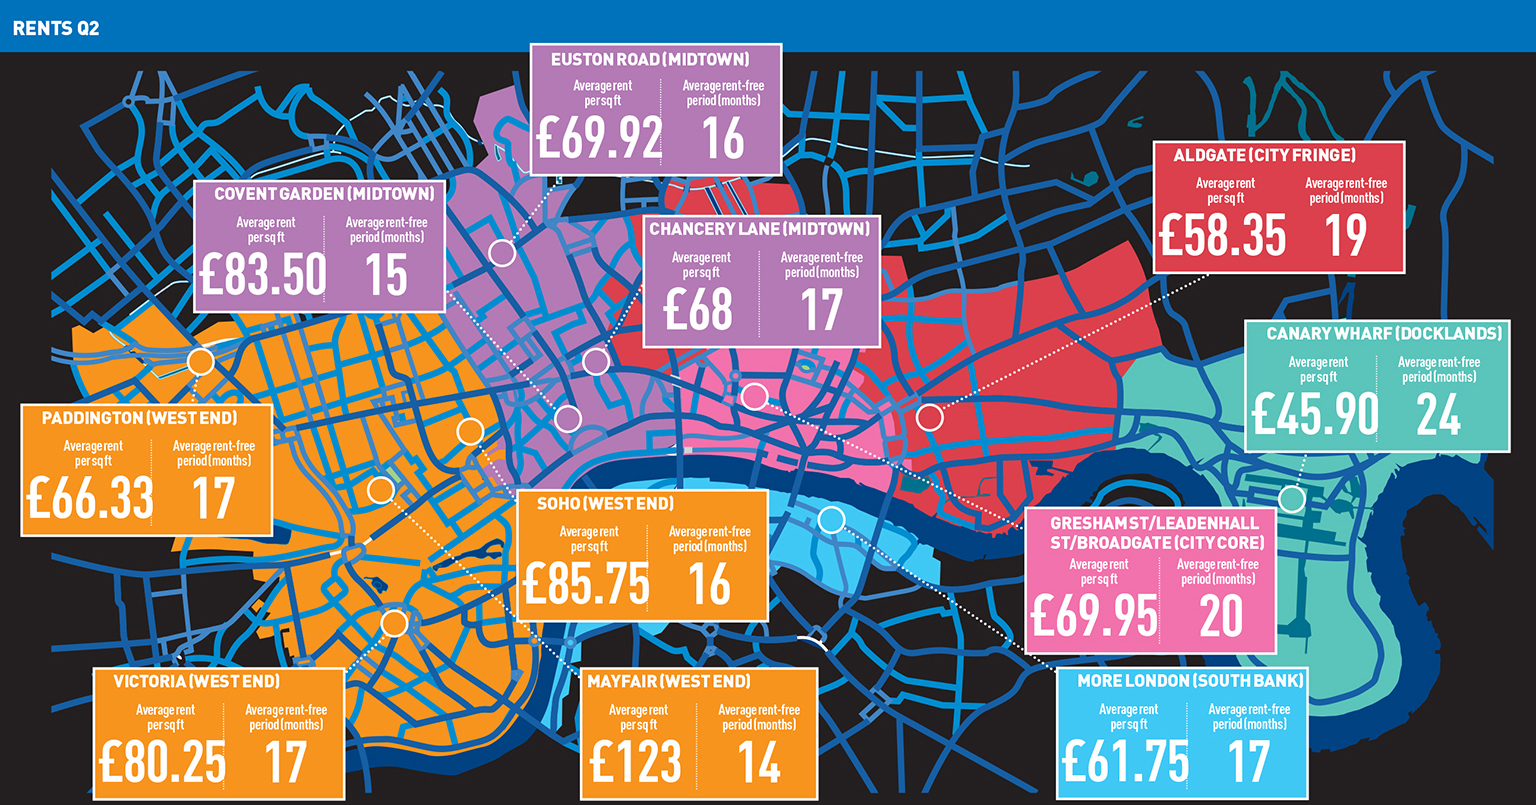 Rents and rent-free periods, Q2 2016. Click to enlarge[/caption]
Rent frees are of course the place it shows first, with agents pointing to landlords having to add two to three months to a typical 10-year term.
“We have not seen rents change, but we probably have begun to see incentives move out a little bit to get deals over the line,” says Stephen Clifton, Knight Frank’s head of central London. But, he warns: “The larger financial occupiers are mindful they have fewer options, and it will cost them more.”
Quiet anyway
Overall, there is a feeling that the slowdown was coming anyway, even if few would have said so before the vote. Some think the referendum result could even be a good thing for the coming quarter.
“It’s not all armageddon,” says Stephen Down, head of central London at Savills. “There has been a general slowdown in the past 12 months as the cycle has matured, which has been exaggerated by the lead-up to the referendum. And that coincided with a slow point in the year, which I expect will exaggerate the take-up levels in Q3.”
It is a view others share. “With that decision hanging out there, there were a lot of people waiting to see what the outcome was. If you did not have to, you would not make a decision,” says Hanrahan.
“Now, there will be some action just through normal churn, while others will just park it and come back to it later, but I expect it will exaggerate the take-up levels in Q3.”
Around the sub-markets, the statistics paint the same picture for the quarter: take-up down by 51.6% in the City compared to the year before, 32.4% in the West End, and 34.5% in Midtown, with occupiers baulking at committing to space amid such uncertainty. The South Bank was the only sub-market to escape a large decrease with take-up down by 1.9%, itself more the result of a quiet Q2 in 2015.
For the quarter, there were just three deals over 50,000 sq ft: Charles Stanley Group taking 50,306 sq ft at 55 Bishopsgate, EC2; Schön Klinik’s 54,413 sq ft at 64-66 Wigmore Street, W1; and 85,792 sq ft let to Amazon at Principal Place, EC2.
Enquiry levels up
“The question is, now the vote has gone the other way to what people wanted, what will happen?” says BNP Paribas Real Estate head of central London leasing Dan Bayley.
Many report healthy levels of enquiries after 24 June, because regardless of the uncertainty, tenants still need space.
“The second quarter I think will be remembered as a bit of a holding pattern, both on the letting and investment side, where so many decisions were being tempered by the result of Brexit,” says Knight Frank’s Clifton.
“Now we know, viewing levels have actually gone up. There are nine requirements in excess of 100,000 sq ft. Some of those are on hold, but those that were on we think are still on.”
Increased demand from lawyers
Negotiations for leaving could lead to thousands of jobs coming back to London, along with associated supportive positions.
“We have been seeing the tech and fintech sector slowing down,” says Savills’ Down, “and that’s a trend we will see over the next 18 months. But equally, there will be increased demand from lawyers and accountants, particularly in the short term, which could lead to increased take-up.”
Digby Flower, chairman of UK & Ireland and head of London markets at Cushman & Wakefield, agrees: “The professional firms, the lawyers and accountants, are beneficiaries of this, as people try to work out what it means in legal and accounting terms for their business.”
But it is hard to cut the numbers to support that at present. Last quarter, professional services accounted for 7% of take-up, the TMT sector 30.5%, and financial occupiers 18%. There would need to be a lot of new lawyers to replace that demand.
In conclusion
So, is it too early to tell whether there is a market being talked up, or is it all doom and gloom? There won’t be any real answers before September, if then, but in the meantime the market continues. Tenants still need space.
“I would sum it up as unsurprisingly underwhelming,” says BNP PRE’s Bayley. “But despite the referendum results, the mood music in the market now, four weeks post-Brexit, is feeling a bit more positive. Put it this way, I would put a lot of money on Q3 being stronger than Q2.”
Credit where credit's due
Political bombshells and the UK’s exit from the EU or not, nothing should detract from CBRE having taken the top spot in the London office agency league table for the second time in the past 18 months.
Despite not acting on anything over 40,000 sq ft, the agent managed to increase its market share in Q2, allowing it to pip Cushman & Wakefield to the top spot. The pair were separated by just 0.3 percentage points or 13,000 sq ft. JLL took third place with 200,000 sq ft and a 14.9% market share.
In the battle of the sub-markets, CBRE managed to grasp the top spot in the West End and City, while Cushman & Wakefield took the Docklands and City fringe, helped by its letting at Principal Place.
But in tough market conditions, it was the smaller agencies that made the most gains. Farebrother took the top spot in Midtown, boosted by a 37,318 sq ft letting at Weston House, High Holborn, WC1, while Union Street Partners led in the South Bank, securing eight deals in a tight market.
Strutt & Parker and Allsop also both made it into the overall top 10, by acting on the lettings at Soho Square and Principal Place respectively.
Central London investment

No need to panic
With take-up in the doldrums, investment was also down.
At £3.2bn, quarter-on-quarter levels fell just 6%, but the market had already seen a very slow start to the year. Against Q2 2015, investment was down by 30.5%.
But the panic that many were expecting seemed absent.
“I’m not going to be overly optimistic, but it is by no means what we saw post-Lehmans,” says Stephen Down, Savills head of central London.
“I am not sure we are going to get a big dump of stock – both Henderson and Aberdeen have been selling for a while, and the feedback we are getting from the other funds is they will be managed.”
Down adds that most of the stock owned is regional. “If they chuck four or five billion into the market, it’s not going to flick the dial that much. I want to see some stock, but I cannot see [the REITs] doing a great deal,” he adds.
Much of the heat already seemed to have left the investment market last year, with investment volumes hovering around the £3bn-£3.5bn mark. Competitive pricing in the City and West End meant yields had long surpassed peak-2007 levels.
INVESTMENT AGENT LEAGUE TABLE Q2 2016
| RANK | AGENT | TOTAL (£M) | MARKET SHARE |
|---|---|---|---|
| 1 | Cushman & Wakefield | 1,427.50 | 21% |
| 2 | Knight Frank | 1,020.81 | 15% |
| 3 | Savills | 934.68 | 14% |
| 4 | Colliers International | 529.65 | 8% |
| 5 | GM Real Estate | 479.05 | 7% |
| 6 | JLL | 471.65 | 7% |
| 7 | Eastdil Secured | 381.00 | 6% |
| 8 | CBRE | 279.43 | 4% |
| 9 | Allsop | 187.60 | 3% |
| 10 | Strutt & Parker | 160.25 | 2% |
Essentially, a correction and re-pricing could be good for the market, though there might not be a free for all.According to Rob Hayes at Colliers International, global capital, the search for yield, safe haven status and a lack of debt will also continue to drive the investment market. “They might be general concerns for the investment market, but there is sufficient weight of capital that deals might be done if there is a glimpse of an advantage [yields moving out],” he says. “They might taken a more open view that it might take a fall, but in the longer term it will come back.”
“The market needs repricing, but given where bond and interest rates are, for those looking for bargains, I think they are going to be disappointed,” says Down.

TOP 25 AGENTS Q2 2016
| RANK | AGENCY | SQ FT DISPOSED | NO OF DEALS | SHARE (%) |
|---|---|---|---|---|
| 1 | CBRE | 561,996 | 58 | 23.3 |
| 2 | Cushman & Wakefield | 552,942 | 41 | 23.0 |
| 3 | JLL | 358,904 | 42 | 14.9 |
| 4 | Colliers International | 239,793 | 41 | 10.0 |
| 5 | Knight Frank | 225,113 | 29 | 9.3 |
| 6 | Savills | 203,007 | 16 | 8.4 |
| 7 | Strutt & Parker | 148,930 | 11 | 6.2 |
| 8 | Allsop | 125,202 | 10 | 5.2 |
| 9 | Farebrother | 111,523 | 15 | 4.6 |
| 10 | GM Real Estate | 92,091 | 6 | 3.8 |
| 11 | Tuckerman | 83,139 | 20 | 3.5 |
| 12 | Edward Charles & Partners | 81,849 | 10 | 3.4 |
| 13 | Anton Page LLP | 80,131 | 27 | 3.3 |
| 14 | BNP Paribas Real Estate | 78,985 | 13 | 3.3 |
| 15 | Gerald Eve | 67,279 | 10 | 2.8 |
| 16 | GN2 | 54,413 | 1 | 2.3 |
| 17 | James Andrew International Limited | 50,588 | 2 | 2.1 |
| 18 | Ingleby Trice | 46,504 | 9 | 1.9 |
| 19 | Union Street Partners | 37,834 | 9 | 1.6 |
| 20 | Pilcher Hershman | 35,533 | 2 | 1.5 |
| 21 | Bilfinger GVA | 32,066 | 6 | 1.3 |
| 22 | Cherryman | 31,693 | 4 | 1.3 |
| 23 | BBG Real Estate Advisers | 29,039 | 4 | 1.2 |
| 24 | Gryphon Property Partners | 28,708 | 2 | 1.2 |
| 25 | Strettons Limited | 27,102 | 8 | 1.1 |
DATA DASHBOARD
[caption id="attachment_856529" align="aligncenter" width="570"]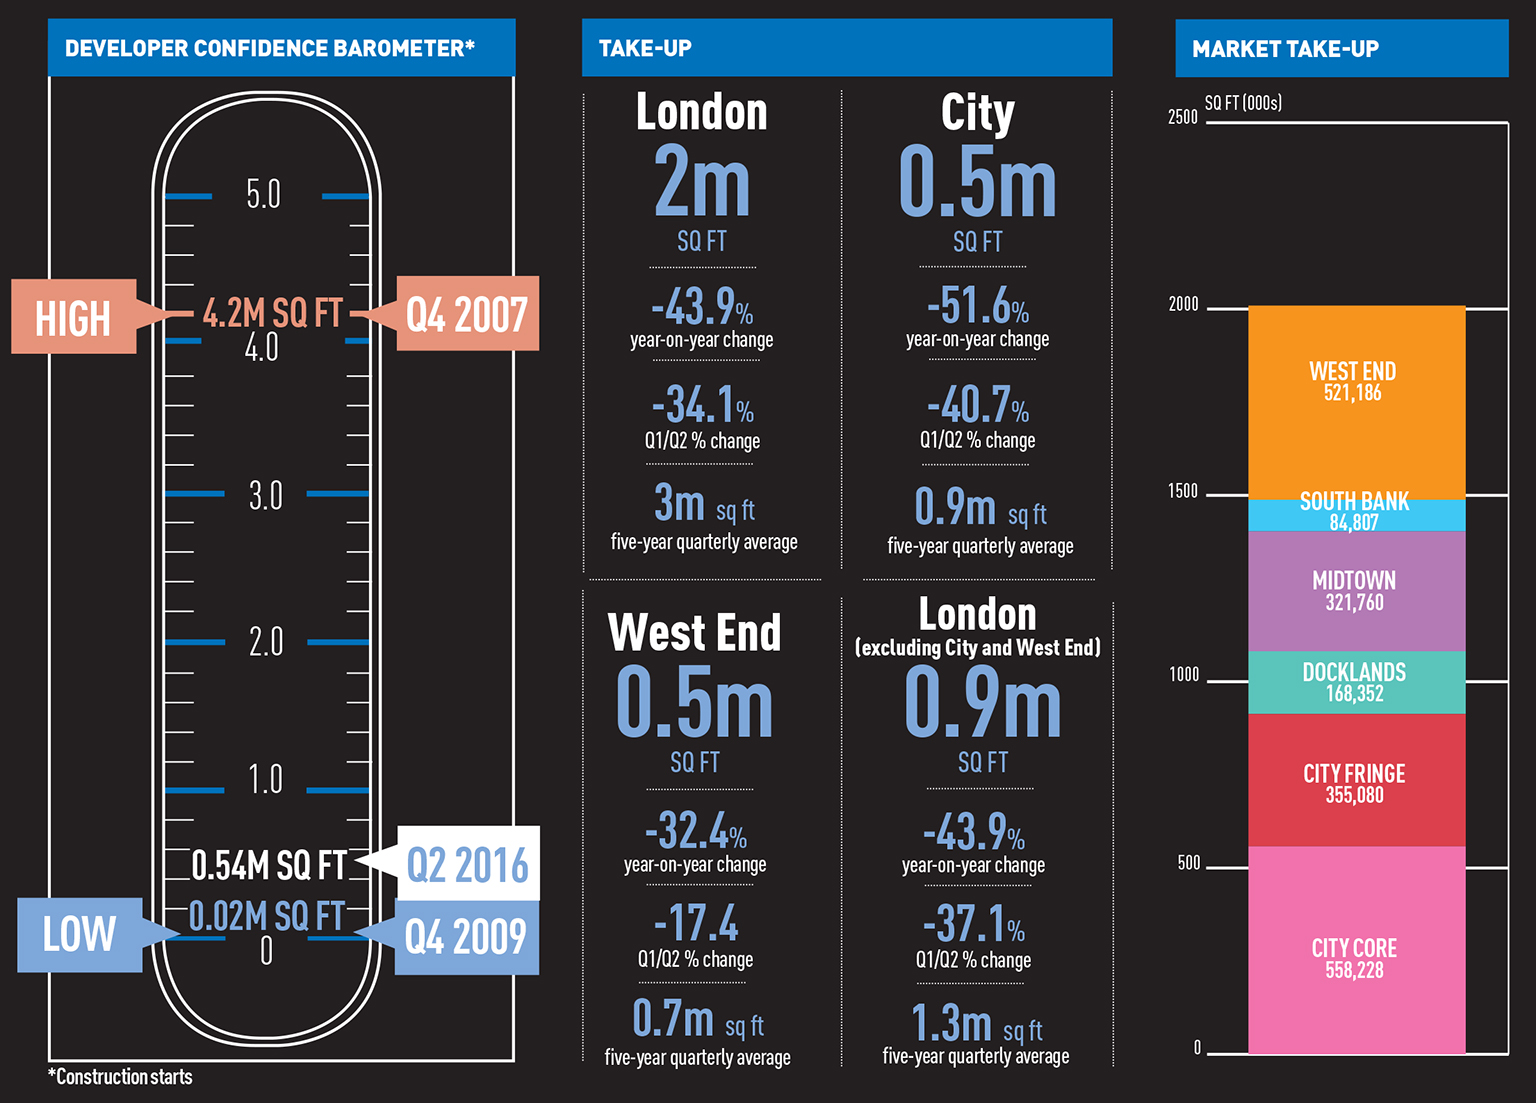 Click to enlarge[/caption]
TOP FIVE DEALS |
|||
|---|---|---|---|
[caption id="attachment_847294" align="aligncenter" width="570"]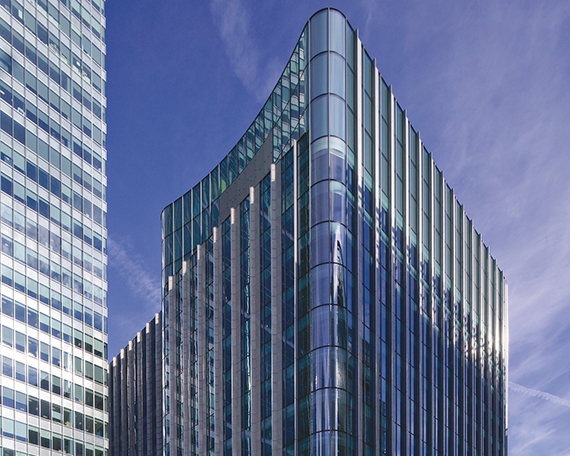 5 Churchill Place, E1[/caption] 5 Churchill Place, E1[/caption] |
|||
Rank |
Occupier and building |
Size (sq ft) |
Market |
1 |
Amazon, Principal Place, EC2 | 85,792 | City fringe |
2 |
Schon Klinik, 64-66 Wigmore Street, W1 | 54,413 | West End |
3 |
Charles Stanley Group, 55 Bishopsgate, EC2 | 50,306 | City core |
4 |
Instant Managed Offices, Beaufort House, EC3 | 47,101 | City core |
5 |
Gorkana, 5 Churchill Place, E1 | 39,989 | Docklands |
FROM THE ARCHIVES
• LONDON OFFICES MARKET ANALYSIS: Q1 2016
• LONDON OFFICES MARKET ANALYSIS: Q4 2015
• To send feedback, e-mail alex.peace@estategzette.com or tweet @egalexpeace or @estatesgazette


