Either could describe the London office market in Q1. Alexander Peace reports
Has it dodged a bullet or is this just a brief hiatus? Unlike London office investments, which plummeted in Q1, leasing figures held firm.But though some are choosing to seek comfort in numbers which landed ahead of the five-year quarterly average, a growing number of the capital’s agents believe there is bad news to come.
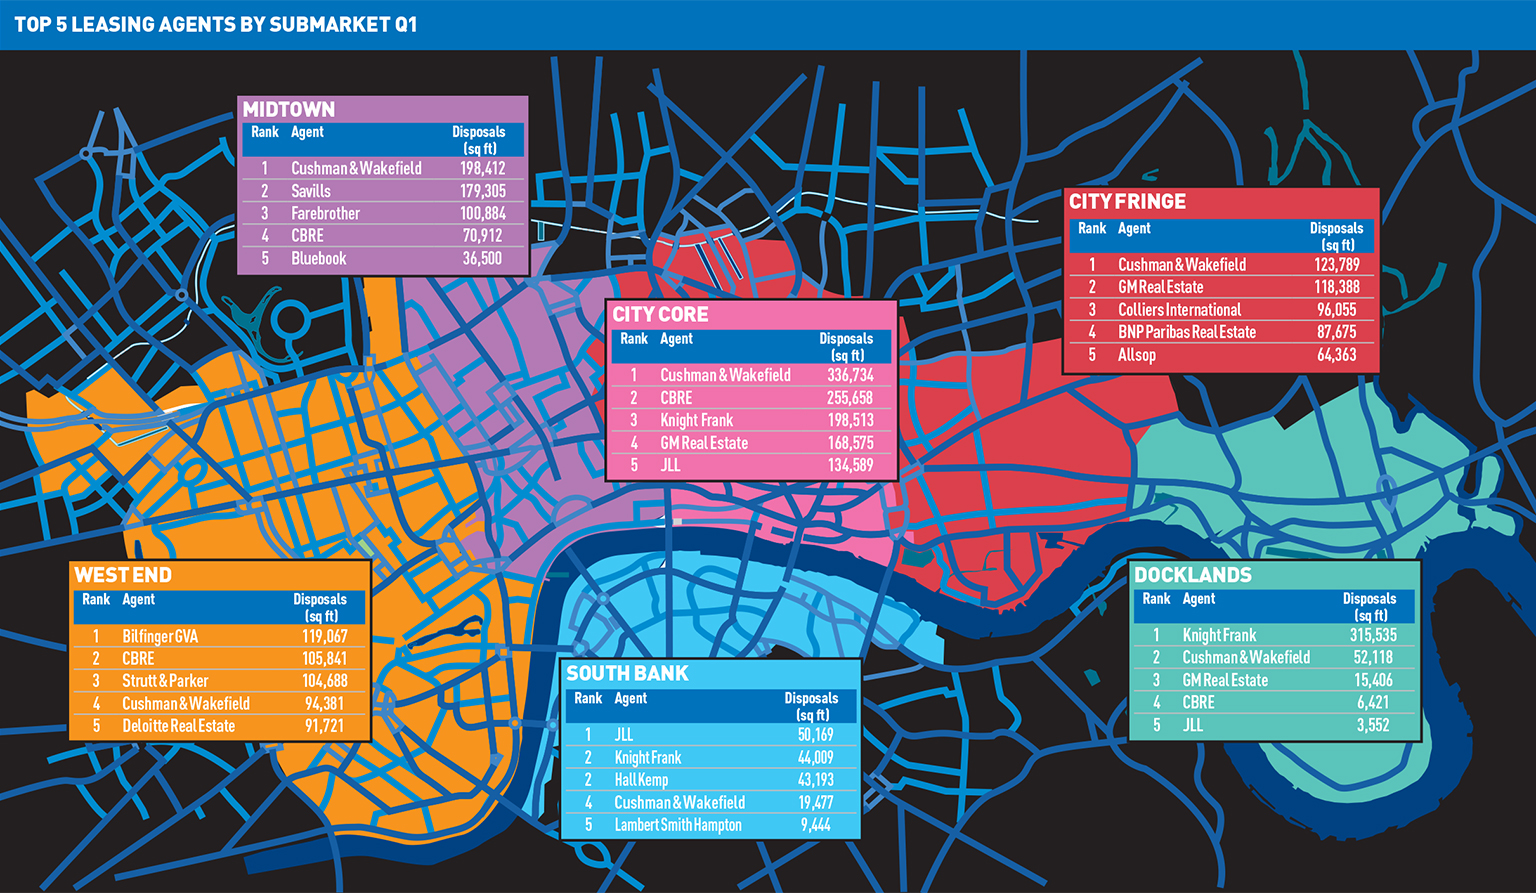
[caption id="attachment_847669" align="alignright" width="400"] Top 5 leasing agents by submarket Q1 2016. Click to enlarge[/caption]
Total take-up across London of 5.1m sq ft was up by 6.2% on Q1 2015, and comfortably above the five-year Q1 average of 2.8m sq ft, according to EGi’s London Offices Research. Thomson Reuters taking 315,500 sq ft at Docklands made 80% of the submarkets total, and seemingly saved the day. Without it, take-up would have slipped by nearly 5% on Q1 2015.
“If I were a betting man, I expect in Q2 the leasing market will catch up with the investment market,” says James Roberts, chief economist at Knight Frank.
“The investment market can very quickly respond to events, whereas the leasing market is shaped by a lot of other considerations.”
And Roberts is not alone. “I would not be surprised if we see the monthly take-up figures dip from now until June,” says Philip Pearce, executive director of central London at Savills. “The sub-5,000 sq ft market is still pretty strong, but north of that there is a pause for breath. Unless you have to trade now, why would you? You would negotiate a deal, but not execute it.”
Average deals sizes took a tumble this quarter, down by a third since Q1 2015. Just 11 deals were signed over the 50,000 sq ft threshold.
And there are other indicators of a weakening market, with availability up for the first time since Q1 2015.
Occupiers still need space though. Much of the demand, according to Adrian Crooks, head of JLL’s West End office, is structural, not expansionary, and – EU referendum or not – he sees it continuing.
Many point back to just 12 months ago and the general election, which failed to have a discernible impact. As Dan Gaunt, head of city agency at Knight Frank, puts it: “These road blocks happen all the way though the city’s leasing market.”
Thomson Reuters and the TMT sector
That said, Knight Frank has cause to be bullish this quarter, acting on 658,000 sq ft of space and moving to second place in the overall agency ranking.
This was aided by its acting on the largest deal of the quarter, that Thomson Reuters sublet of 5 Canada Square, E14, from Credit Suisse. The letting to the media giant was long in the offing, first reported in June last year and finally signed in March.
What it also showed is another strong lease to a TMT occupier which, as a sector, accounted for 32% of take-up this quarter – the largest proportion in the market.
It is certainly not the first time a TMT letting has topped the table, Facebook took 227,000 sq ft at 1 Rathbone Square, W1, last quarter, but it is further proof of the maturity of a sector that was little more than a buzzword four years ago.
Around the markets
The Thomson Reuter’s deal made it a stonking quarter for Docklands, tripling the take-up seen in Q1 2015, and still 50% up on Q4, though such a small market is easy to be influenced by big deals.
A more sedate pace prevailed around the rest of the market, and the mood among agents was as much business as usual as holding back for the referendum.
“You always find Q1 tends to be a bit slower anyway, so the figures are reasonably healthy,” says Elaine Rossall, head of research at Cushman & Wakefield.
In the City, there was a decline in take-up – at 942,000 sq ft, this was 20% down on Q1 2015, though this is still well above the five-year Q1 quarterly average of 809,000 sq ft, and more a result of a busy Q1 last year.
Meanwhile, in the West End, take-up was 21% up on Q1 2015 at 638,000 sq ft, thanks to two big lettings: WeWork taking 107,000 sq ft at 2 Eastbourne Terrace, W2, and Capita committing to 87,000 sq ft at the Copyright Building, W1.
While this shows a degree of confidence in the market, it is important to remember that many of those deals were agreed months ago and, like Thomson Reuters, are only just getting over the line now.
“We were actually pleasantly surprised with the Q1 stats, which were virtually bang on trend,” said Adrian Crooks, head of JLL’s West End office. “A lot of those deals were agreed in Q3 or Q4, but even from a West End perspective, the New Look and Capita deals were sizeable.”
Furthermore, while a TMT letting topped the table, a look at the largest deals of the quarter shows a healthy spread across the occupier types, indicating demand from across the board [see tenant breakdown below].
Alongside those mentioned above, asset manager Investec took 148,000 sq ft in the City at 30 Gresham St, EC2, alongside investment bank Jeffries taking 119,000 sq ft at 100 Bishopsgate, EC3, while New Look took 127,000 sq ft at Kings Cross Central, N1, and AECOM 88,000 sq ft at the Aldgate Tower, E1, in the city fringe.
But while Q1 may have been relatively on form, worry remains around what may happen in Q2.
For many like Chris Valentine, associate director in the JLL West End team, the slowdown represents a hiatus rather than a juddering halt. “From my perspective, there will be a pause for breath prior to Brexit, but I think fundamentally, our market has been underpinned by very robust economics in terms of supply and demand,” he says.
“The worst thing in our market is uncertainty – uncertainty drives inactivity.”
Thomson Reuters: the consolidation
[caption id="attachment_847671" align="alignright" width="300"] 5 Canada Square, E14[/caption]
Thomson Reuters eventually signed its Docklands deal this quarter. Under the deal, all of its London operations will be consolidated under one roof, bar a data centre in Canary Wharf, which means moving out of over eight offices as leases expire.
The deal will also see staff decamp from its 240,000 sq ft letting at the iconic 30 South Colonnade, E14, home of the famous ticker, which will itself be included in the shift, or at least a newer version of it.
According to a spokesman: “Consolidating most of our London operations into one location will reduce complexity, increase collaboration between colleagues, and enable us to better serve our customers.
“5 Canada Square is a prime location where we can remain close to our customers while ensuring minimal disruption to our employees.”
It is set to start moving into the new office from 5 Canada Square, E14, towards the end of the year. The shift from other offices will be phased as leases expire.
That consolidation has already started, with operations at Aldgate House, EC3, where Thomson Financial had 60,092 sq ft, vacated last year.
The elephant in the room
Mergers and acquisitions were always going to be a big theme this year and one that for London started to come through in 2014. But only now are deals such as Colliers International’s takeover of Hatton Real Estate starting to show through.
One agent found itself well clear at the top of the London office agents league table this quarter: Cushman & Wakefield. After finding tenants for 825,000 sq ft, C&W lifted itself head and shoulders above the competition and grabbed the top spot in three markets.
Acting on deals including the Investec and New Look lettings, it worked itself more than 150,000 sq ft clear at the top with wins in midtown and the city fringe, and wrestling the City crown from CBRE.
But with the acquisition of DTZ finally taking effect, did it effectively buy the title?
“When you put together two significant businesses, the market coverage and visibility you get is pretty significant, and we are only at the early stages of reaping the benefits of that,” says Andrew Tyler, head of West End office agency at Cushman & Wakefield.
Knight Frank was pushed into second place, but was top in the Docklands, boosted by its sole agent instruction on the largest deal for the quarter to Thomson Reuters.
CBRE moved down to third and JLL to fourth place. In fact, a relatively slow showing from CBRE and JLL meant quite a shake-up all round, with Bilfinger GVA taking the West End top spot through its 107,000 sq ft WeWork letting.
Central London investment
The capital market
London’s investment market took a hit in Q1 2016, falling by nearly a third on Q4 2015 totals and a double-digit dive compared with the same period last
year.
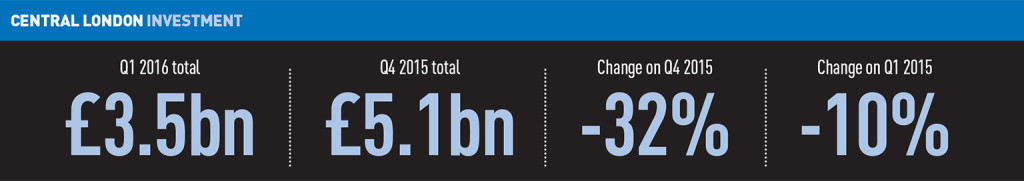
Total investment volumes of £3.5bn are down by 10% on Q1 2015, and have declined by 32% on Q4 2015 echoing a similar fall in investment volumes nationwide.
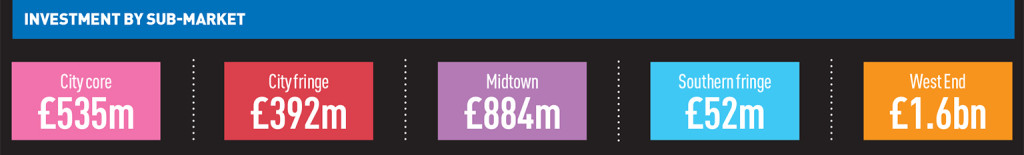
West End totals made up almost half the total, or £1.6bn. Notable deals for the quarter include the sale of the Thomas More Square Estate, E1, which Resolution bought from Land Securities for £300m, and Grosvenor’s sale of Almack House in St James’, SW1, for £225m to Pontegadea, Zara founder Amancio Ortega’s property investment company.
CBRE landed the top spot in EGi’s London investment league table, securing £1.4m. JLL was pushed into second as its investment volumes fell by almost one fifth.
Investment agent league table Q1 2016
Agent
Total (m)
Market share
CBRE
£1,253.8
17%
JLL
£1,244.5
17%
Savills
£1,129.4
15%
Cushman & Wakefield
£868.4
12%
GM Real Estate
£615.1
8%
Colliers International
£518.2
7%
Knight Frank
£364.2
5%
Ashwell Rogers
£300
4%
Michael Elliott
£266.9
4%
BNP Paribas Real Estate
£156
2%
Needless to say, the EU referendum is leading to a wait-and-see mentality among investors, with currency declines being one of a raft of reasons cited for delayed investment.
“Investors appear to be taking a pause in terms of investment activity in the city office market,” says Hoong Wey Woon, KPMG UK’s real estate corporate finance lead.
“They are waiting for the situation around the referendum to be resolved. Until this happens, transaction activity is likely to be subdued compared to the past few quarters.”
But alongside delays, there have also been indications of a slowdown in the market, with the price of prime London property looking increasingly high. According to IPD yields, West End and City assets have surpassed their pre-recession lows.
The collapse of Fubon’s deal to buy Cannon Place, EC4, for £500m was a recent blow to the market, though this happened after the Q1 figures were in.
The Taiwanese insurer’s purchase eventually fell through when it was refused regulatory approval.
Seller Hines said it is now in discussions with an alternative buyer.
Other wider macro-economic factors are taking their toll on investment, from Russia to collapsing oil prices and the slowdown in Chinese and emerging market economies.
The Q1 decline is by no means the largest seen in recent years: in Q1 2014, investment volumes fell as low as £1.5bn.
According to Knight Frank’s chief economist James Roberts, investors are like planes above an airport, circling and waiting to make the decision to come in to land.
“The investment market has seen a very distinct drop-off in volume, well below what we have been used to seeing.
“There are a lot of people interested, but I feel as a result of the Brexit, demand has gone into a holding pattern, with political uncertainty scaring off activity.”
The latest take-up figures, submarket analysis and availability rates in the London offices market
Tweet your reactions to @estatesgazette
Follow @EstatesGazette
Click here to receive your free copy of the London Offices Market Analysis
LOMA Q1 2016
Ticking along… or a ticking time bomb?
Either could describe the London office market in Q1. Alexander Peace reports
Has it dodged a bullet or is this just a brief hiatus? Unlike London office investments, which plummeted in Q1, leasing figures held firm.
But though some are choosing to seek comfort in numbers which landed ahead of the five-year quarterly average, a growing number of the capital’s agents believe there is bad news to come.
[caption id="attachment_847669" align="alignright" width="400"] Top 5 leasing agents by submarket Q1 2016. Click to enlarge[/caption]
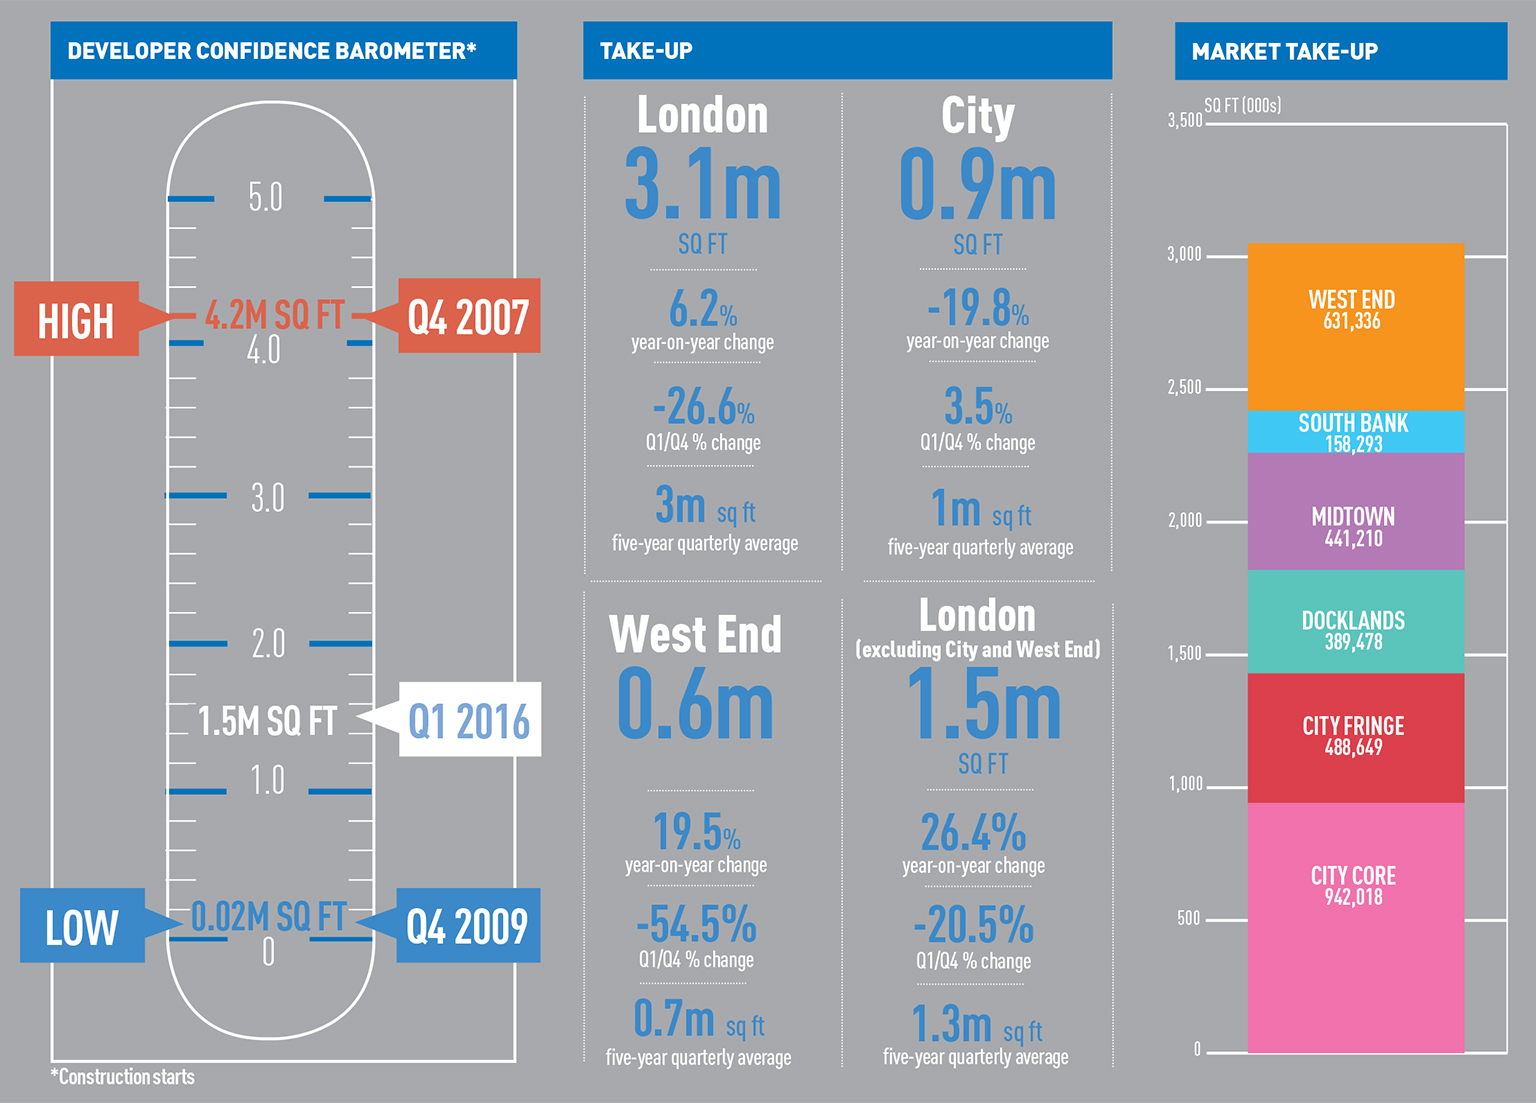
Total take-up across London of 5.1m sq ft was up by 6.2% on Q1 2015, and comfortably above the five-year Q1 average of 2.8m sq ft, according to EGi’s London Offices Research. Thomson Reuters taking 315,500 sq ft at Docklands made 80% of the submarkets total, and seemingly saved the day. Without it, take-up would have slipped by nearly 5% on Q1 2015.
“If I were a betting man, I expect in Q2 the leasing market will catch up with the investment market,” says James Roberts, chief economist at Knight Frank.
“The investment market can very quickly respond to events, whereas the leasing market is shaped by a lot of other considerations.”
And Roberts is not alone. “I would not be surprised if we see the monthly take-up figures dip from now until June,” says Philip Pearce, executive director of central London at Savills. “The sub-5,000 sq ft market is still pretty strong, but north of that there is a pause for breath. Unless you have to trade now, why would you? You would negotiate a deal, but not execute it.”
Average deals sizes took a tumble this quarter, down by a third since Q1 2015. Just 11 deals were signed over the 50,000 sq ft threshold.
And there are other indicators of a weakening market, with availability up for the first time since Q1 2015.
Occupiers still need space though. Much of the demand, according to Adrian Crooks, head of JLL’s West End office, is structural, not expansionary, and – EU referendum or not – he sees it continuing.
Many point back to just 12 months ago and the general election, which failed to have a discernible impact. As Dan Gaunt, head of city agency at Knight Frank, puts it: “These road blocks happen all the way though the city’s leasing market.”
Thomson Reuters and the TMT sector
That said, Knight Frank has cause to be bullish this quarter, acting on 658,000 sq ft of space and moving to second place in the overall agency ranking.
This was aided by its acting on the largest deal of the quarter, that Thomson Reuters sublet of 5 Canada Square, E14, from Credit Suisse. The letting to the media giant was long in the offing, first reported in June last year and finally signed in March.
What it also showed is another strong lease to a TMT occupier which, as a sector, accounted for 32% of take-up this quarter – the largest proportion in the market.
It is certainly not the first time a TMT letting has topped the table, Facebook took 227,000 sq ft at 1 Rathbone Square, W1, last quarter, but it is further proof of the maturity of a sector that was little more than a buzzword four years ago.
Around the markets
The Thomson Reuter’s deal made it a stonking quarter for Docklands, tripling the take-up seen in Q1 2015, and still 50% up on Q4, though such a small market is easy to be influenced by big deals.
A more sedate pace prevailed around the rest of the market, and the mood among agents was as much business as usual as holding back for the referendum.
“You always find Q1 tends to be a bit slower anyway, so the figures are reasonably healthy,” says Elaine Rossall, head of research at Cushman & Wakefield.
In the City, there was a decline in take-up – at 942,000 sq ft, this was 20% down on Q1 2015, though this is still well above the five-year Q1 quarterly average of 809,000 sq ft, and more a result of a busy Q1 last year.
Meanwhile, in the West End, take-up was 21% up on Q1 2015 at 638,000 sq ft, thanks to two big lettings: WeWork taking 107,000 sq ft at 2 Eastbourne Terrace, W2, and Capita committing to 87,000 sq ft at the Copyright Building, W1.
While this shows a degree of confidence in the market, it is important to remember that many of those deals were agreed months ago and, like Thomson Reuters, are only just getting over the line now.
“We were actually pleasantly surprised with the Q1 stats, which were virtually bang on trend,” said Adrian Crooks, head of JLL’s West End office. “A lot of those deals were agreed in Q3 or Q4, but even from a West End perspective, the New Look and Capita deals were sizeable.”
Furthermore, while a TMT letting topped the table, a look at the largest deals of the quarter shows a healthy spread across the occupier types, indicating demand from across the board [see tenant breakdown below].
Alongside those mentioned above, asset manager Investec took 148,000 sq ft in the City at 30 Gresham St, EC2, alongside investment bank Jeffries taking 119,000 sq ft at 100 Bishopsgate, EC3, while New Look took 127,000 sq ft at Kings Cross Central, N1, and AECOM 88,000 sq ft at the Aldgate Tower, E1, in the city fringe.
But while Q1 may have been relatively on form, worry remains around what may happen in Q2.
For many like Chris Valentine, associate director in the JLL West End team, the slowdown represents a hiatus rather than a juddering halt. “From my perspective, there will be a pause for breath prior to Brexit, but I think fundamentally, our market has been underpinned by very robust economics in terms of supply and demand,” he says.
“The worst thing in our market is uncertainty – uncertainty drives inactivity.”
Thomson Reuters: the consolidation
[caption id="attachment_847671" align="alignright" width="300"] 5 Canada Square, E14[/caption]
Thomson Reuters eventually signed its Docklands deal this quarter. Under the deal, all of its London operations will be consolidated under one roof, bar a data centre in Canary Wharf, which means moving out of over eight offices as leases expire.
The deal will also see staff decamp from its 240,000 sq ft letting at the iconic 30 South Colonnade, E14, home of the famous ticker, which will itself be included in the shift, or at least a newer version of it.
According to a spokesman: “Consolidating most of our London operations into one location will reduce complexity, increase collaboration between colleagues, and enable us to better serve our customers.
“5 Canada Square is a prime location where we can remain close to our customers while ensuring minimal disruption to our employees.”
It is set to start moving into the new office from 5 Canada Square, E14, towards the end of the year. The shift from other offices will be phased as leases expire.
That consolidation has already started, with operations at Aldgate House, EC3, where Thomson Financial had 60,092 sq ft, vacated last year.
The elephant in the room
Mergers and acquisitions were always going to be a big theme this year and one that for London started to come through in 2014. But only now are deals such as Colliers International’s takeover of Hatton Real Estate starting to show through.
One agent found itself well clear at the top of the London office agents league table this quarter: Cushman & Wakefield. After finding tenants for 825,000 sq ft, C&W lifted itself head and shoulders above the competition and grabbed the top spot in three markets.
Acting on deals including the Investec and New Look lettings, it worked itself more than 150,000 sq ft clear at the top with wins in midtown and the city fringe, and wrestling the City crown from CBRE.
But with the acquisition of DTZ finally taking effect, did it effectively buy the title?
“When you put together two significant businesses, the market coverage and visibility you get is pretty significant, and we are only at the early stages of reaping the benefits of that,” says Andrew Tyler, head of West End office agency at Cushman & Wakefield.
Knight Frank was pushed into second place, but was top in the Docklands, boosted by its sole agent instruction on the largest deal for the quarter to Thomson Reuters.
CBRE moved down to third and JLL to fourth place. In fact, a relatively slow showing from CBRE and JLL meant quite a shake-up all round, with Bilfinger GVA taking the West End top spot through its 107,000 sq ft WeWork letting.
Central London investment
The capital market
London’s investment market took a hit in Q1 2016, falling by nearly a third on Q4 2015 totals and a double-digit dive compared with the same period last
year.
Total investment volumes of £3.5bn are down by 10% on Q1 2015, and have declined by 32% on Q4 2015 echoing a similar fall in investment volumes nationwide.
West End totals made up almost half the total, or £1.6bn. Notable deals for the quarter include the sale of the Thomas More Square Estate, E1, which Resolution bought from Land Securities for £300m, and Grosvenor’s sale of Almack House in St James’, SW1, for £225m to Pontegadea, Zara founder Amancio Ortega’s property investment company.
CBRE landed the top spot in EGi’s London investment league table, securing £1.4m. JLL was pushed into second as its investment volumes fell by almost one fifth.
Investment agent league table Q1 2016
Agent
Total (m)
Market share
CBRE
£1,253.8
17%
JLL
£1,244.5
17%
Savills
£1,129.4
15%
Cushman & Wakefield
£868.4
12%
GM Real Estate
£615.1
8%
Colliers International
£518.2
7%
Knight Frank
£364.2
5%
Ashwell Rogers
£300
4%
Michael Elliott
£266.9
4%
BNP Paribas Real Estate
£156
2%
Needless to say, the EU referendum is leading to a wait-and-see mentality among investors, with currency declines being one of a raft of reasons cited for delayed investment.
“Investors appear to be taking a pause in terms of investment activity in the city office market,” says Hoong Wey Woon, KPMG UK’s real estate corporate finance lead.
“They are waiting for the situation around the referendum to be resolved. Until this happens, transaction activity is likely to be subdued compared to the past few quarters.”
But alongside delays, there have also been indications of a slowdown in the market, with the price of prime London property looking increasingly high. According to IPD yields, West End and City assets have surpassed their pre-recession lows.
The collapse of Fubon’s deal to buy Cannon Place, EC4, for £500m was a recent blow to the market, though this happened after the Q1 figures were in.
The Taiwanese insurer’s purchase eventually fell through when it was refused regulatory approval.
Seller Hines said it is now in discussions with an alternative buyer.
Other wider macro-economic factors are taking their toll on investment, from Russia to collapsing oil prices and the slowdown in Chinese and emerging market economies.
The Q1 decline is by no means the largest seen in recent years: in Q1 2014, investment volumes fell as low as £1.5bn.
According to Knight Frank’s chief economist James Roberts, investors are like planes above an airport, circling and waiting to make the decision to come in to land.
“The investment market has seen a very distinct drop-off in volume, well below what we have been used to seeing.
“There are a lot of people interested, but I feel as a result of the Brexit, demand has gone into a holding pattern, with political uncertainty scaring off activity.”
TOP 25 AGENTS Q1 2016
Agency
Disposed
No of deal
Share
1
Cushman & Wakefield
824,912
33
25%
2
Knight Frank
657,868
21
20%
3
CBRE
468,512
41
14%
4
GM Real Estate
330,621
12
10%
5
JLL
298,569
34
9%
6
Savills
263,119
21
8%
7
BNP Paribas Real Estate
226,906
20
7%
8
Colliers International
199,396
41
6%
9
Strutt & Parker
168,471
19
5%
10
Bilfinger GVA
156,175
9
5%
11
Deloitte Real Estate
129,953
6
4%
12
Hall Kemp
116,684
6
3%
13
Farebrother
115,322
15
3%
14
Bluebook
112,474
6
3%
15
HMC Surveyors Limited
87,150
1
3%
16
Allsop
86,682
11
3%
17
Edward Charles & Partners
56,546
12
2%
18
Anton Page
53,803
14
2%
19
Newton Perkins
51,167
12
2%
20
Frost Meadowcroft
37,741
7
1%
21
HNG Limited
37,547
8
1%
22
Monmouth Dean
35,403
8
1%
23
Stirling Ackroyd Limited
31,573
10
1%
24
Ingleby Trice
30,636
7
1%
25
Hanover Green
29,779
7
1%
Back to top
• City: click here
• West End: click here
• Midtown: click here
• City Fringe: click here
• Docklands: click here
• Southern Fringe: click here
• Dashboard: click here
• From the archives: click here
CITY
Top agents Q1 2016: City
Agency
Disposed
No of deals
Share
1
Cushman & Wakefield
336,734
13
35%
2
CBRE
255,658
15
26%
3
Knight Frank
198,513
7
21%
4
GM Real Estate
168,575
4
17%
5
JLL
134,589
19
14%
6
BNP Paribas Real Estate
91,059
11
9%
7
Strutt & Parker
52,492
8
5%
8
Savills
49,039
8
5%
9
Newton Perkins
47,162
11
5%
10
Bilfinger GVA
32,442
4
3%
Back to top
WEST END
Top agents Q1 2016: West End
Agency
Disposed
No of deals
Share
1
Bilfinger GVA
119,067
3
16%
2
CBRE
105,842
15
14%
3
Strutt & Parker
104,688
8
14%
4
Cushman & Wakefield
94,381
9
13%
5
Deloitte Real Estate
91,721
3
13%
6
HMC Surveyors Limited
87,150
1
12%
7
Bluebook
75,974
4
10%
8
Colliers International
73,013
15
10%
9
Knight Frank
67,599
7
9%
10
JLL
63,681
6
9%
Back to top
MIDTOWN
Top agents Q1 2016: Midtown
Agency
Disposed
No of deals
Share
1
Cushman & Wakefield
198,412
4
44%
2
Savills
179,305
5
40%
3
Farebrother
100,884
11
23%
4
CBRE
70,912
5
16%
5
Bluebook
36,500
2
8%
6
GM Real Estate
28,252
3
6%
7
Colliers International
27,368
7
6%
8
Edward Charles & Partners
24,077
2
5%
9
JLL
20,404
2
5%
10
Monmouth Dean
14,862
1
3%
Back to top
CITY FRINGE
Top agents Q1 2016: City fringe
Agency
Disposed
No of deals
Share
1
Cushman & Wakefield
123,789
4
23%
2
GM Real Estate
118,388
3
22%
3
Colliers International
96,055
18
18%
4
BNP Paribas Real Estate
87,675
1
16%
5
Allsop
64,363
4
12%
6
Hall Kemp
60,974
1
11%
7
Anton Page
49,345
12
9%
8
Stirling Ackroyd
31,573
10
6%
9
Pilcher Hershman
28,482
1
5%
10
JLL
26,174
2
5%
Back to top
DOCKLANDS
Top agents Q1 2016: Docklands
Agency
Disposed
No of deals
Share
1
Knight Frank
315,536
1
81%
2
Cushman & Wakefield
52,118
1
13%
3
GM Real Estate
15,406
2
4%
4
CBRE
6,421
1
2%
5
JLL
3,552
1
1%
6
Cherryman
1,030
1
0%
Back to top
SOUTHERN FRINGE
Top agents Q1 2016: Southern fringe
AGENCY
DISPOSED
NO OF DEALS
SHARE
1
JLL
50,169
4
31%
2
Knight Frank
44,009
2
27%
3
Hall Kemp
43,193
1
27%
4
Cushman & Wakefield
19,477
2
12%
5
Lambert Smith Hampton
9,444
3
6%
6
Hanover Green
7,256
1
4%
7
CBRE
5,887
2
4%
8
Capita Symonds
3,227
1
2%
9
Colliers International
2,960
1
2%
10
Workplace Company (The)
2,588
1
2%
Back to top
DATA DASHBOARD
[caption id="attachment_847296" align="aligncenter" width="569"] Click to enlarge[/caption]
TOP FIVE DEALS
[caption id="attachment_847294" align="aligncenter" width="570"] 100 Bishopsgate, EC3[/caption]
Rank
Occupier and building
Size (sq ft)
Market
1
Thomson Reuters, 5 Canada Square, E14
315,536
Docklands
2
Investec (UK), 30 Gresham St, EC2
147,939
City core
3
New Look,Building R7, King's Cross Central, NW1
127,094
Midtown
4
Jefferies Investment Bank, 100 Bishopsgate, EC3
118,575
City core
5
WeWork, 2 Eastbourne Terrace, W2
106,812
West End
Back to top
FROM THE ARCHIVES
• LONDON OFFICES MARKET ANALYSIS: Q4 2015
Back to top
• To send feedback, e-mail alex.peace@estategzette.com or tweet @egalexpeace or @estatesgazette


 Top 5 leasing agents by submarket Q1 2016. Click to enlarge[/caption]
Total take-up across London of 5.1m sq ft was up by 6.2% on Q1 2015, and comfortably above the five-year Q1 average of 2.8m sq ft, according to EGi’s London Offices Research. Thomson Reuters taking 315,500 sq ft at Docklands made 80% of the submarkets total, and seemingly saved the day. Without it, take-up would have slipped by nearly 5% on Q1 2015.
“If I were a betting man, I expect in Q2 the leasing market will catch up with the investment market,” says James Roberts, chief economist at Knight Frank.
“The investment market can very quickly respond to events, whereas the leasing market is shaped by a lot of other considerations.”
And Roberts is not alone. “I would not be surprised if we see the monthly take-up figures dip from now until June,” says Philip Pearce, executive director of central London at Savills. “The sub-5,000 sq ft market is still pretty strong, but north of that there is a pause for breath. Unless you have to trade now, why would you? You would negotiate a deal, but not execute it.”
Average deals sizes took a tumble this quarter, down by a third since Q1 2015. Just 11 deals were signed over the 50,000 sq ft threshold.
And there are other indicators of a weakening market, with availability up for the first time since Q1 2015.
Occupiers still need space though. Much of the demand, according to Adrian Crooks, head of JLL’s West End office, is structural, not expansionary, and – EU referendum or not – he sees it continuing.
Many point back to just 12 months ago and the general election, which failed to have a discernible impact. As Dan Gaunt, head of city agency at Knight Frank, puts it: “These road blocks happen all the way though the city’s leasing market.”
Top 5 leasing agents by submarket Q1 2016. Click to enlarge[/caption]
Total take-up across London of 5.1m sq ft was up by 6.2% on Q1 2015, and comfortably above the five-year Q1 average of 2.8m sq ft, according to EGi’s London Offices Research. Thomson Reuters taking 315,500 sq ft at Docklands made 80% of the submarkets total, and seemingly saved the day. Without it, take-up would have slipped by nearly 5% on Q1 2015.
“If I were a betting man, I expect in Q2 the leasing market will catch up with the investment market,” says James Roberts, chief economist at Knight Frank.
“The investment market can very quickly respond to events, whereas the leasing market is shaped by a lot of other considerations.”
And Roberts is not alone. “I would not be surprised if we see the monthly take-up figures dip from now until June,” says Philip Pearce, executive director of central London at Savills. “The sub-5,000 sq ft market is still pretty strong, but north of that there is a pause for breath. Unless you have to trade now, why would you? You would negotiate a deal, but not execute it.”
Average deals sizes took a tumble this quarter, down by a third since Q1 2015. Just 11 deals were signed over the 50,000 sq ft threshold.
And there are other indicators of a weakening market, with availability up for the first time since Q1 2015.
Occupiers still need space though. Much of the demand, according to Adrian Crooks, head of JLL’s West End office, is structural, not expansionary, and – EU referendum or not – he sees it continuing.
Many point back to just 12 months ago and the general election, which failed to have a discernible impact. As Dan Gaunt, head of city agency at Knight Frank, puts it: “These road blocks happen all the way though the city’s leasing market.”
 5 Canada Square, E14[/caption]
Thomson Reuters eventually signed its Docklands deal this quarter. Under the deal, all of its London operations will be consolidated under one roof, bar a data centre in Canary Wharf, which means moving out of over eight offices as leases expire.
The deal will also see staff decamp from its 240,000 sq ft letting at the iconic 30 South Colonnade, E14, home of the famous ticker, which will itself be included in the shift, or at least a newer version of it.
According to a spokesman: “Consolidating most of our London operations into one location will reduce complexity, increase collaboration between colleagues, and enable us to better serve our customers.
“5 Canada Square is a prime location where we can remain close to our customers while ensuring minimal disruption to our employees.”
It is set to start moving into the new office from 5 Canada Square, E14, towards the end of the year. The shift from other offices will be phased as leases expire.
That consolidation has already started, with operations at Aldgate House, EC3, where Thomson Financial had 60,092 sq ft, vacated last year.
5 Canada Square, E14[/caption]
Thomson Reuters eventually signed its Docklands deal this quarter. Under the deal, all of its London operations will be consolidated under one roof, bar a data centre in Canary Wharf, which means moving out of over eight offices as leases expire.
The deal will also see staff decamp from its 240,000 sq ft letting at the iconic 30 South Colonnade, E14, home of the famous ticker, which will itself be included in the shift, or at least a newer version of it.
According to a spokesman: “Consolidating most of our London operations into one location will reduce complexity, increase collaboration between colleagues, and enable us to better serve our customers.
“5 Canada Square is a prime location where we can remain close to our customers while ensuring minimal disruption to our employees.”
It is set to start moving into the new office from 5 Canada Square, E14, towards the end of the year. The shift from other offices will be phased as leases expire.
That consolidation has already started, with operations at Aldgate House, EC3, where Thomson Financial had 60,092 sq ft, vacated last year.
 Click to enlarge[/caption]
 100 Bishopsgate, EC3[/caption]